2007-04-03
GCrawler
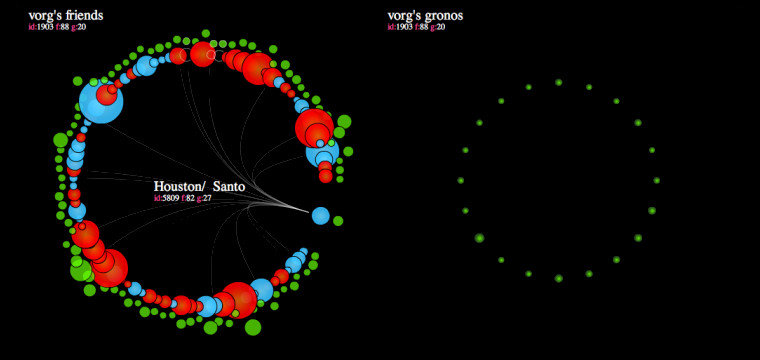
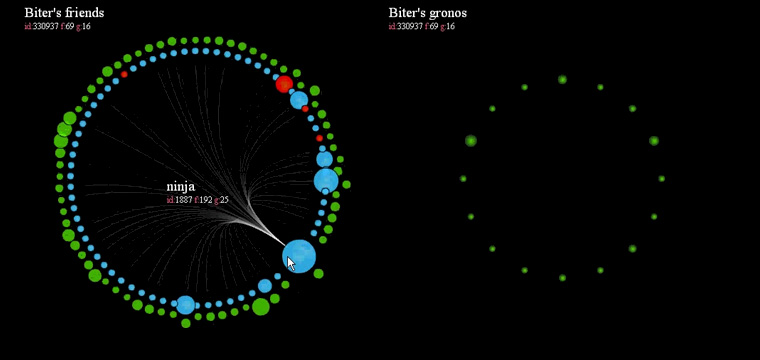
Social network visualization.
It’s circle based interface helps you to explore connections between people. Left side represents my friends. Red dots are women and blue dots are men. The more friends one person has the bigger is it’s dot. Green dots represent number of forums that each person is member of. White lines between selected person and others represent shared friends. On the right side there is list of all forums which I’m member of. Size of each dot depends on number of its members.
Both crawler and visualisation idea were developed by me.
!VIMEO,998405,950,475