2008-12-27
Money Vis
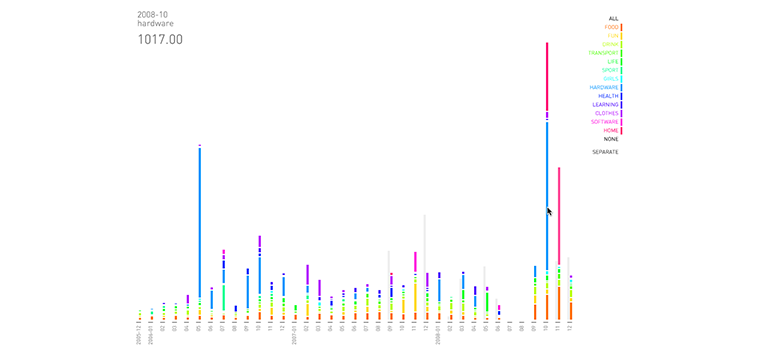
Visualization of my money spending for last three years. I divided all entries in my log into several categories so you can compare how many money I spend for what. This was my project for Interactive Data Visualization course at CIID.
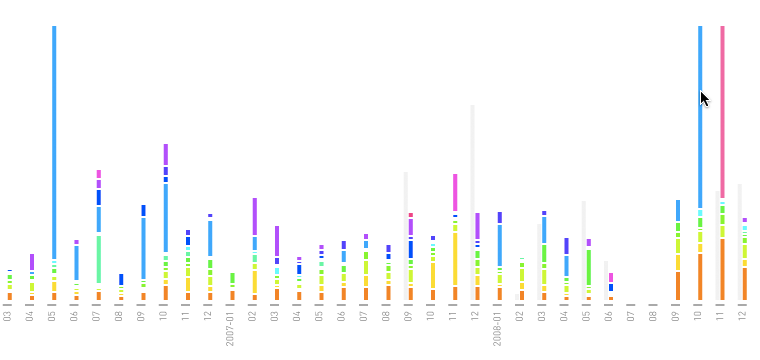
You can display data for each month.
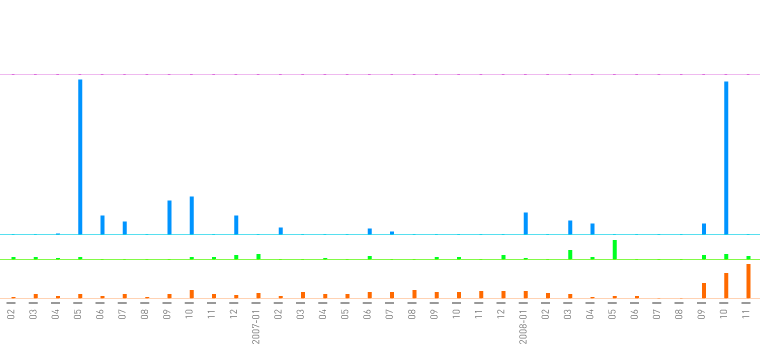
You can filter them by category and split into several parallel graphs
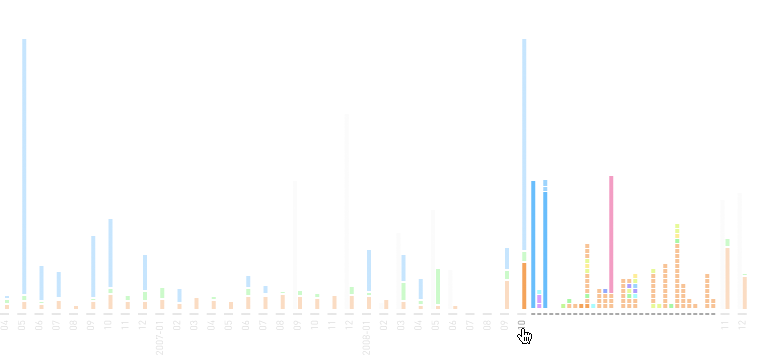
You can even display detailed data for particular month