Quantified Other
Quantified Other visualizes five weeks of my father's Nike Fuel data from October 2015.
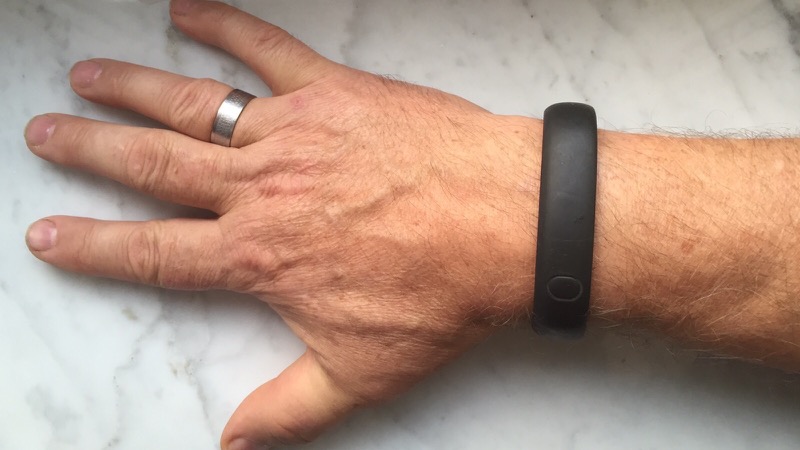
Following my father's car accident in June 2014 I packed my Nike Fuel band and mailed it to him in order to track his recovery progress.
Using the Fuel Band my father collects the Fuel points whenever he moves, walks or does some manual work.
I call the project Quantified Other in opposition to Quantified Self - where one is interested in understanding his own life through data.
I wanted to see how having this live data connection will change our relations, make me more interested in his day to day activities and be a conversation starter during our Skype calls.
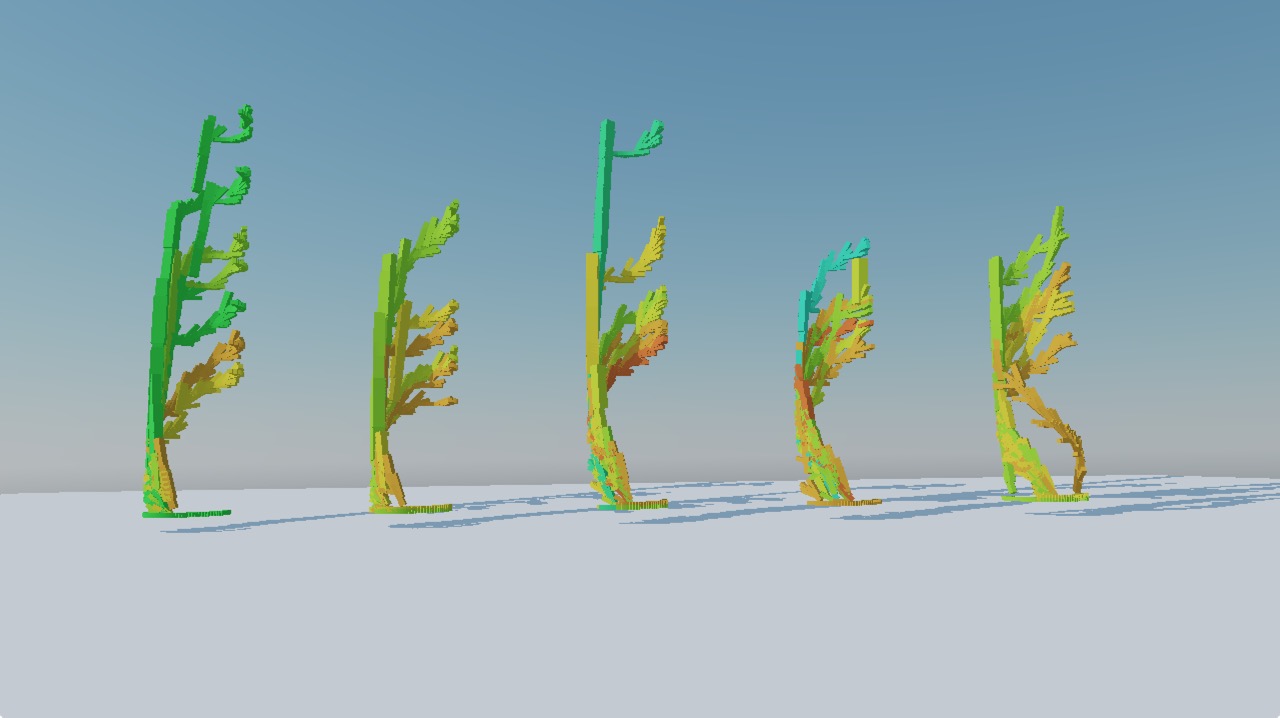
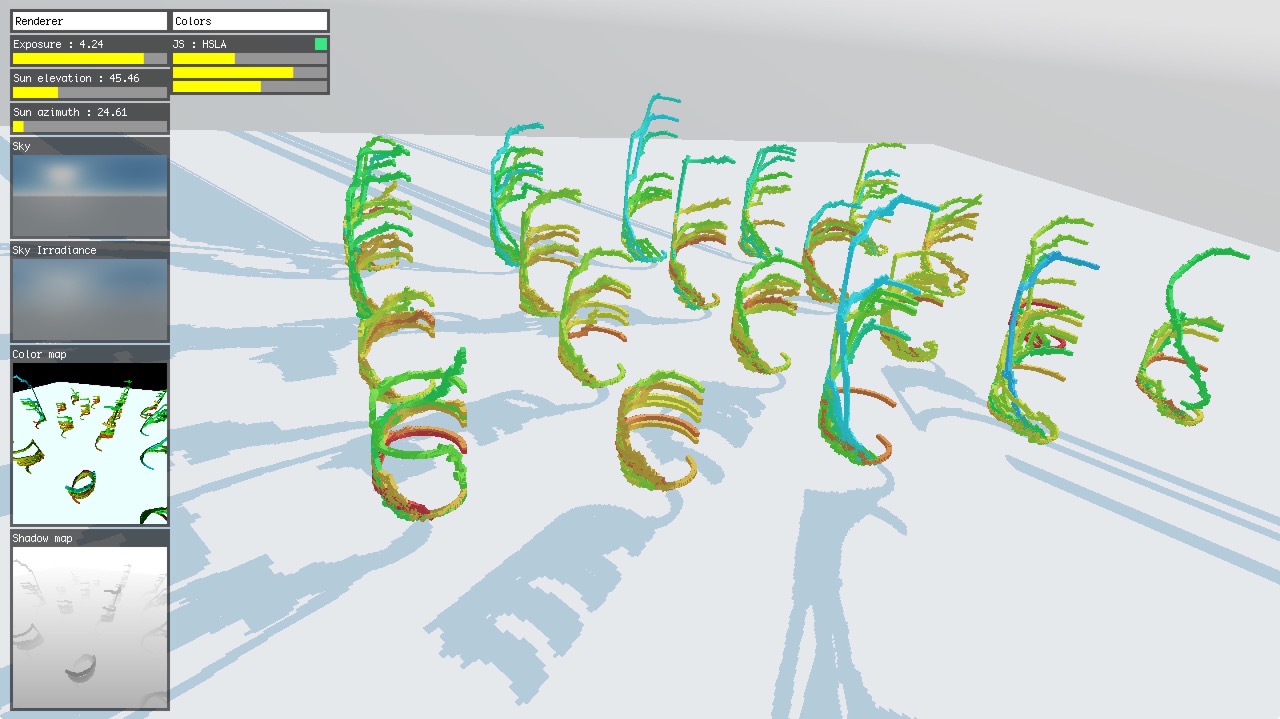
In the video above I grow one plant like structure per week.
Each one of them has seven leaves one per day of the week. The darker the color the more Fuel points he gathered that day.
Each segment of the leaf is 15 minute of activity so there is 96 of them per day.
Not everything went as good as planned. It took few weeks for my Father to start using it and even longer to bother with syncing. We also encountered a syncing problem (bluetooth pairing)
that remained unfixed for the most of 2015 so we lost a lot of data.
Process
Earlier versions and the software used to render the video and experiments with a 'forest' view.
Data
The way Nike Plus visualizes the data is not always clear. Below is the example of two days with similar graphs. Notice though that the second one have 2x the amount of Fuel points.
!IMG2,fuel_1016.jpg,fuel_1027.jpg
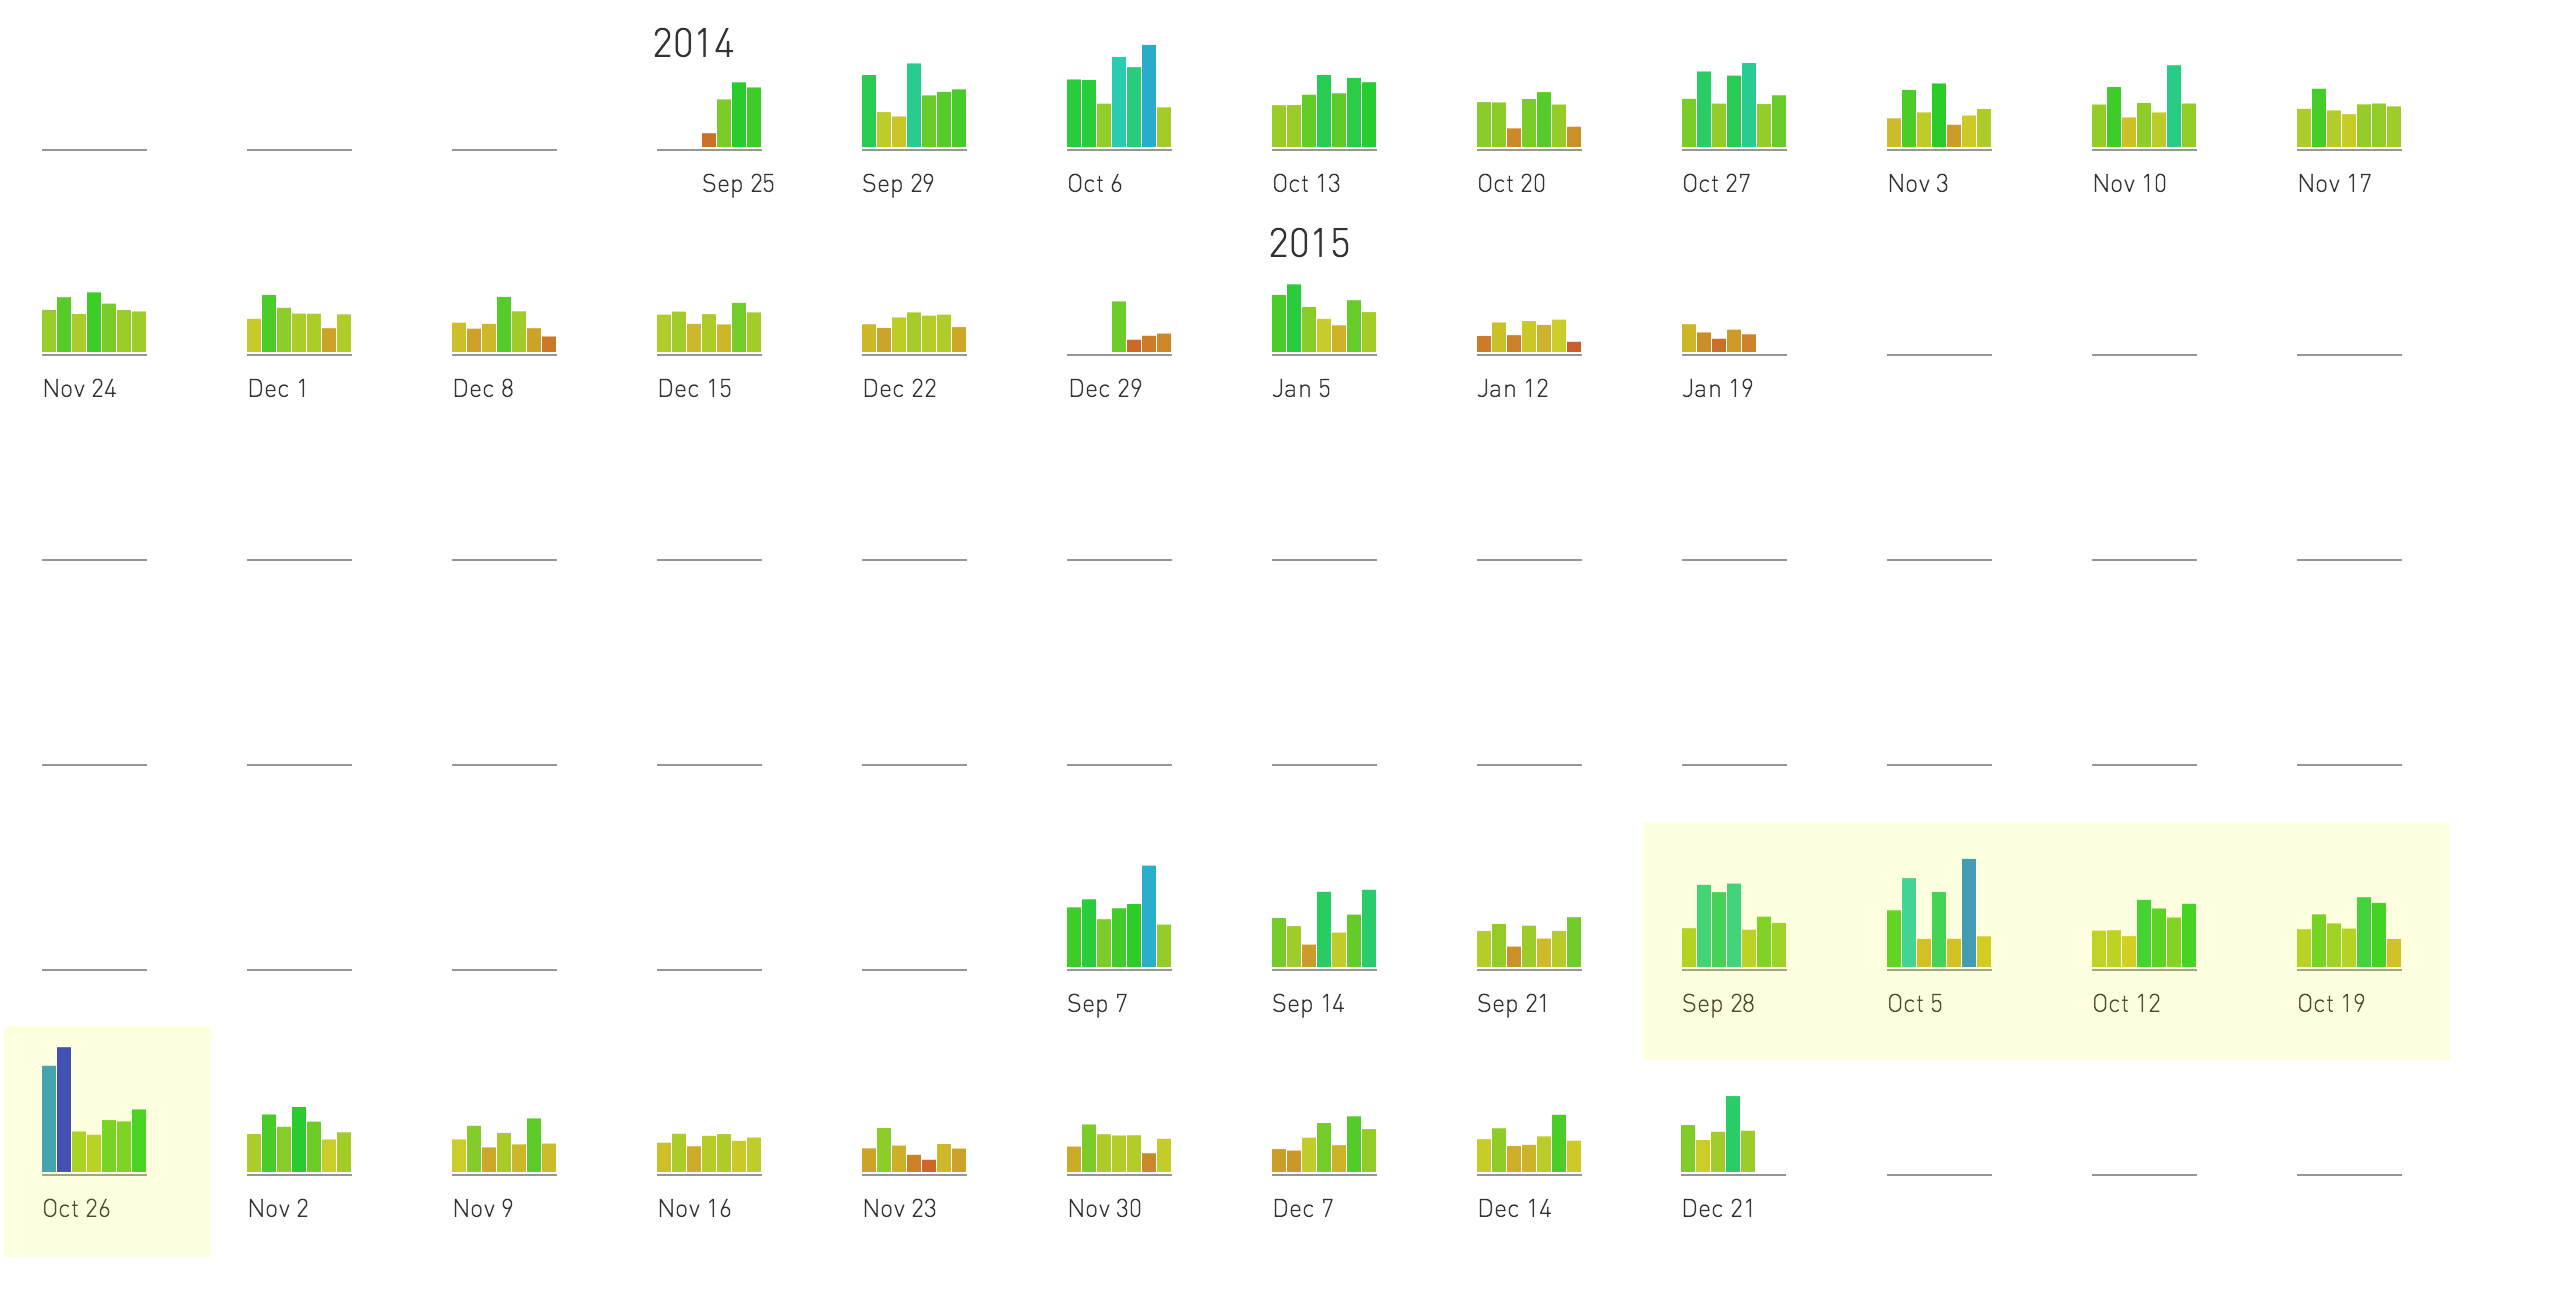
Monthly view also neglects importance of weekly patterns and it's hard to say which days of the week are the most active.
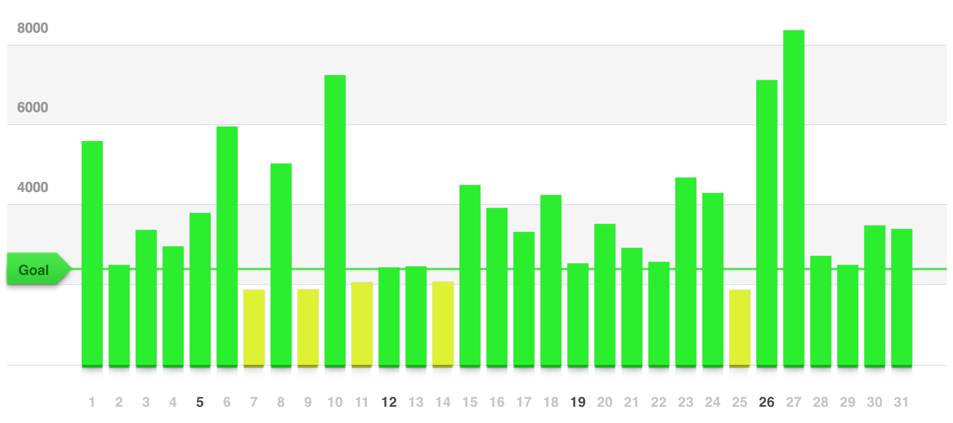
During the process I created my own visualization with all the daily data grouped by weeks. Between January and September 2015 my father has some syncing issues and we have lost the data. Weeks of October 2015 used in the video are highlighted in yellow.